Property Management Co
Kydosa approach to outcome dream enablement
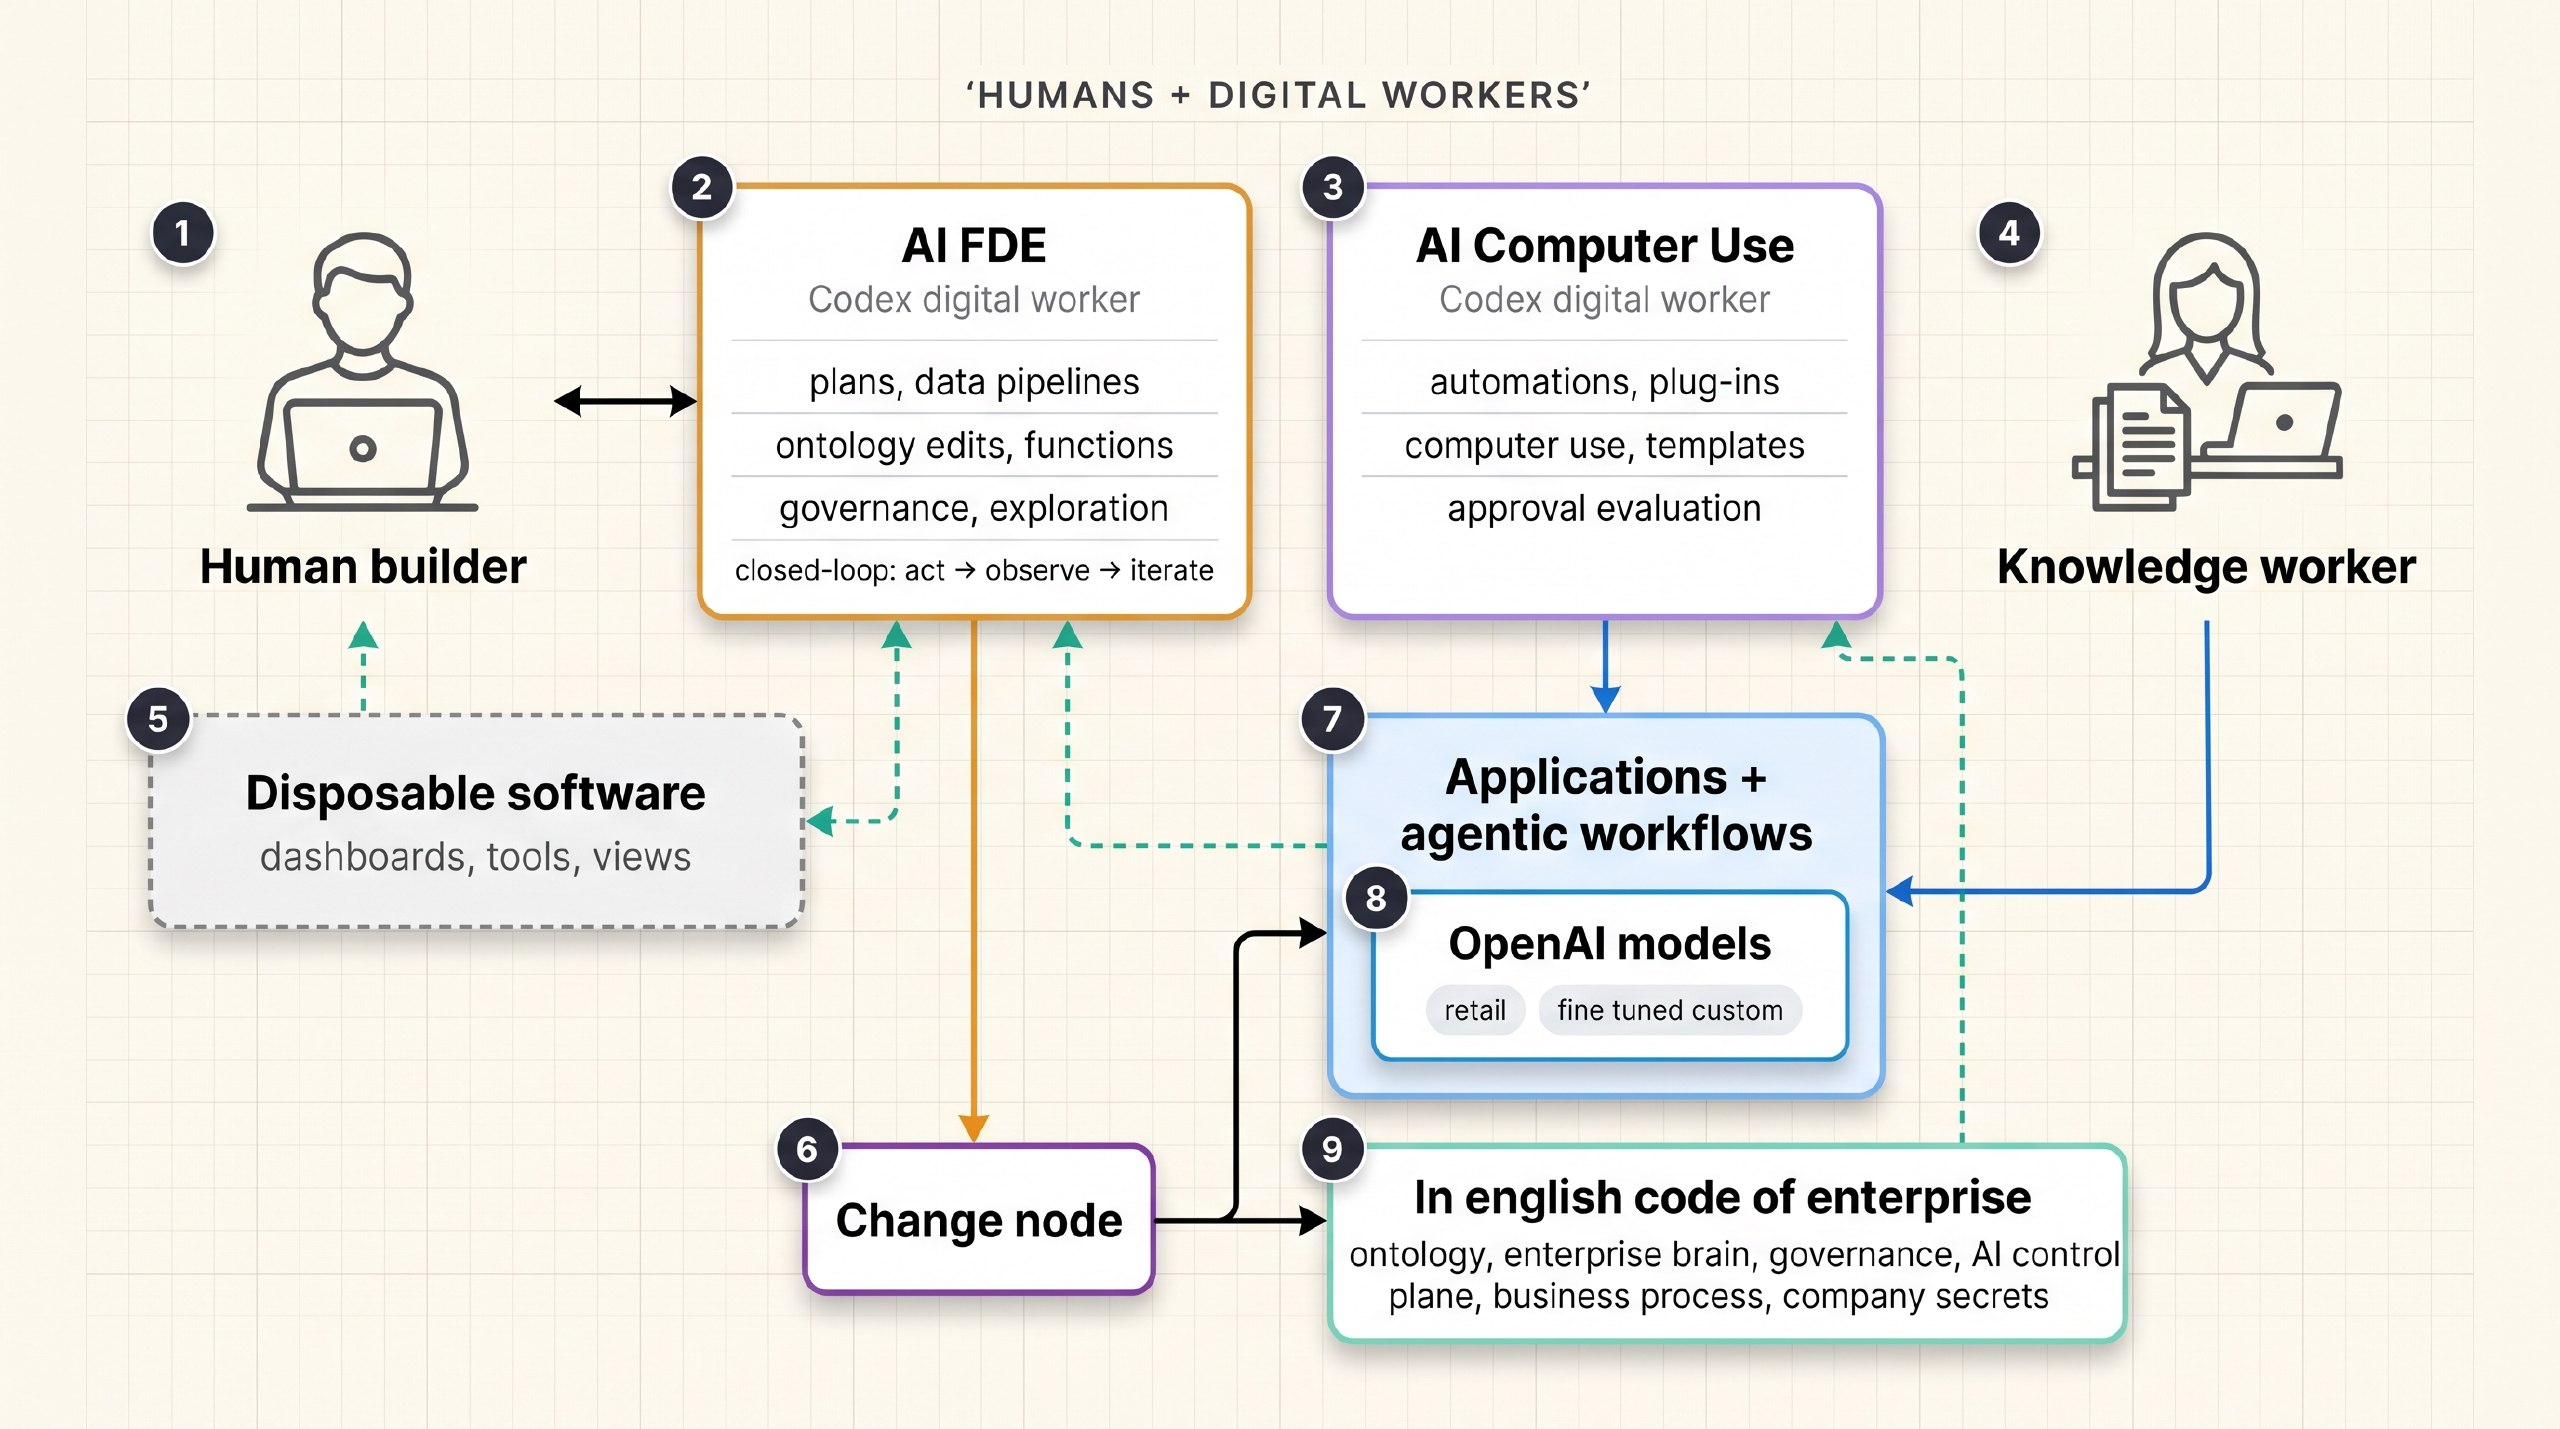
Property Management Co stands up a new DBA (doing business as) brand, website, processes, back office, and front office using an AI-native OS.
Appliance Manufacturing Co
Outcome Deal Example
The client was behind in retail.com sales at top home-improvement partners. An IT tactical ask would not achieve the outcome. The commercial model pivoted to business sales economics: trade spend, go-to-market execution, and a flexible 3-year partnership.
$400Kinitial IT ask
$500M+target annualized revenue lift
0.95%of in-scope retail.com sales
3 yearsflexible partnership term
1. Establish the goal
Close the online sales gap without treating it like a narrow technology project.
The company was behind competitors in online sales at major retail partners. The value case was not just e-commerce conversion; better retail.com content and lower-funnel execution would also influence store sales.
Revenue growth ambition
The target is total revenue lift, not an online mix math exercise.
Retail.com execution
Plan
Content
Media
Content
Media
Joint plans, lower-funnel spend, pages, data tower.
Online revenue
Retail.com growth
Conversion, share, basket.
Store revenue
Influenced demand
Research online, buy anywhere.
Annualized revenue lift
$500M+
Shoppers are omnichannel: online and in-store sales influence each other. Better online execution drives both in-store and online revenue growth.
2. Wrong buying path
IT budget would have locked the work into scope, not value.
3. Trusted and Incentive Aligned
Move to bigger trade spend budget line item. Bundle product and services
IT cost path
~$400K
- Tech askNeed tools to improve retail.com sales.
- Strategy effortLow budget and no control over outcome.
- Fixed scopeRoadmap, integrations, and documents.
- Value trappedBusiness does not fund a path it does not trust.
pivot
Change the buyer and budget logic
From a cost-center project to a GTM operating product.
Business value path
3 years
- Trade spend poolFund from spend meant to drive retailer growth.
- Outcome productStrategy, control tower, FDEs, inference, and execution.
- Flexible teamCapacity shifts as the bottleneck moves.
- Aligned upsideSmall percentage of total in-scope sales.
Flexible goal aligned operating team
The team can solve for the constraint instead of defending a statement of work.
Flexible GTM team
Reallocate capacity as the constraint moves
Joint business planningRetailer plans, priorities, cadence, and governance.
Marketing spend reviewShift from broad spend to lower-funnel retail media.
Product page executionTitles, bullets, imagery, A+ content, ratings, and reviews.
Control tower + dataSales, inventory, content health, share of voice, and signals.
FDEs + strategyBuild the operating tools while shaping the commercial moves.
Leadership governanceDecisions, issue escalation, and monthly performance readouts.
4. Commercial model
A small percentage of total sales keeps both sides aligned without creating a cost roller coaster.
A percentage of incremental revenue would be too volatile: either zero payment, huge upside, or a higher client price for the same outcome risk. A small percentage of total in-scope retail.com sales creates steadier economics while still tying compensation to the business result. Simple calculation, no debates about dozens of variables.
Value build by quarter
Run-rate lands at $500M at the end of Year 3; value is earned during the ramp.
$500M
annualized run-rate at end of Q12
~$640M
benefit generated during ramp
Value earned
Annualized run-rate
Year 1
Year 2
Year 3
$100MProve it
$250MExpand it
$500MFull run-rate
0.95% of total in-scope sales
Avoid incremental-only volatility
5. P&L value tree
A $400K, 3-month tactical IT project becomes a $24M, 3-year business partnership.
Value tree showing shift in where the effort is funded and where the value is realized.
Value tree / P&L view
Built from public FY2025 company financials and an illustrative internal P&L cube. Brand names are scrubbed; channel structure reflects the case context.
Where the dollars live
Net sales
$15.5B
Revenue lift shows here.
Trade / GTM spend
contra-revenue
Allowances, co-op, promo, retail media.
Cost of products sold
~$13.1B
Gross margin
$2.4B
$500M run-rate converts through margin.
SG&A / IT cost area
$1.6B
Original ~$400K tactical strategy ask.
Capex$389M
Net earnings$318M
How the business manages growth
BrandsScrubbed portfolio
ProductsLarge, small, CPG
ChannelsBuilders, retailers, groups
Managed as: brand x product x channel
Commercial levers
The operating product works here
JBP
Content
Retail media
Assortment
Control tower
Governance
Shift funding, then operate value
Original cost area
~$400K IT strategy ask
Scoped, narrow, and underfunded.
move buying center
Funding moved to
Trade / GTM value pool
Budget source matches retailer execution, media, content, data, FDEs, strategy.
operate outcome
Value realized in
Net sales + gross margin
$500M annualized run-rate benefit flows through the commercial P&L.
$24M / 3-year partnership priced at 0.95% of total sales
Problem frame
Planning is still wired for scarcity, but the constraint moved to demand quality.
Sports Nutrition Co’s legacy operating ontology treated retailer POs and co-man capacity as the primary planning truth. The new graphic shows the flip in one view: most weeks now need better demand sensing, while summer still carries real supply pressure from seasonal protein and co-man constraints.
150-180dingredient to shelf
~50%RTD capacity at Co-Man 1
summerseasonal supply exception
weeklylocked command plan
Ontology map
Constraint flip
The operating constraint moved from scarce supply to noisy demand signals, but summer remains a supply-sensitive exception that the outcome twin has to preserve.
Current flow
From noisy demand to weekly command plan
Outcome twin input gap
Do not optimize until the decision questions are answerable.
The first outcome twin tab is intentionally a question system. Once the priority questions are answered, the next version can convert assumptions into objectives, constraints, confidence bands, and weekly scenario recommendations.
6question domains
18locked inputs
Teamshuman loop
Snowflakesystem of analysis
Value tree
Make the right flavor, in the right region, for the right store.
The outcome twin’s value is not just a better forecast. It protects revenue by preventing avoidable stockouts and protects cost by reducing transfers, markdowns, and trapped inventory when flavor demand splits by geography.
Store-flavor serviceAre the right flavors in the right stores?
Regional imbalanceWhere do stockouts and excess inventory coexist?
Avoidable transfer milesHow much product movement is caused by bad placement?
Gross margin savedLost sales + freight + markdowns avoided.